

The Housing Assessment Resource Tools (HART) project is funded by the Canada Mortgage and Housing Corporation (CMHC) to research solutions to Canada’s Housing Crisis. We offer comprehensive, equity-focused solutions to the unique problems faced by communities of all shapes and sizes cross-country. The goal of the project is to develop standardized, replicable and sustainable tools, along with associated public information and training, to improve the quality of housing supply decision-making at all levels of government across Canada.
The following data, which was compiled using our Housing Needs Assessment Tool, represents information about Housing Need in Saint John, NB using 2016 data from Statistics Canada. 2021 data will be published in 2023.
The full suite of our tools, methodology, and data will be published open source by early 2023.
Area Median Household Income (AMHI) Categories and Shelter Costs (2016)
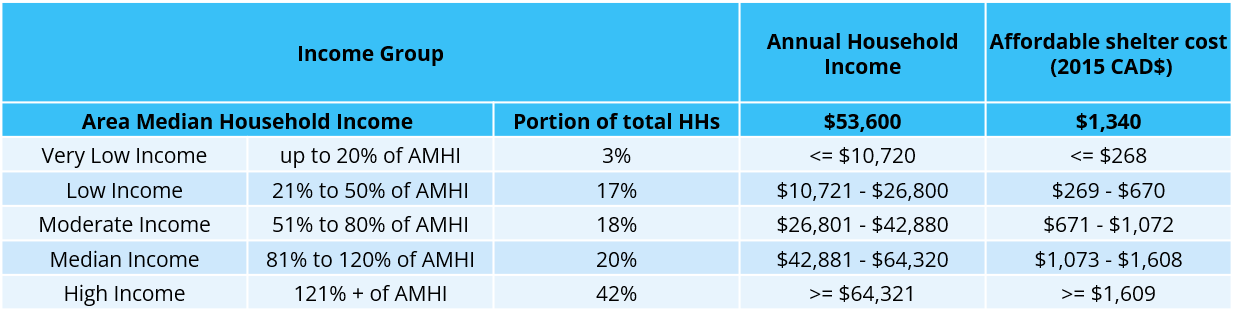
This table shows the income categories used by the HART project, and the characteristics of each group, including their income range and affordable shelter cost.
Percent of Households in Core Housing Need, by Household Income Category (2016)
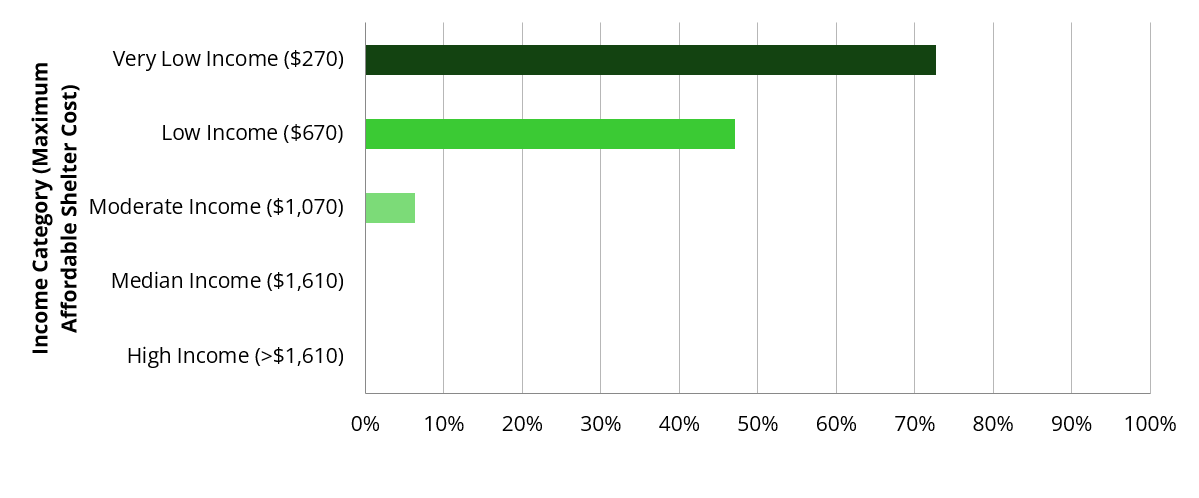
This graph shows the total proportion of households and number of households that were in core housing need in the community according to the 2016 census data. For example, this chart shows that nearly 50% of households in the Low Income category (maximum affordable monthly shelter cost is $670) were in Core Housing Need.
Percent of Household Size Categories in Core Housing Need, by Area Median Household Income (AMHI) (2016)
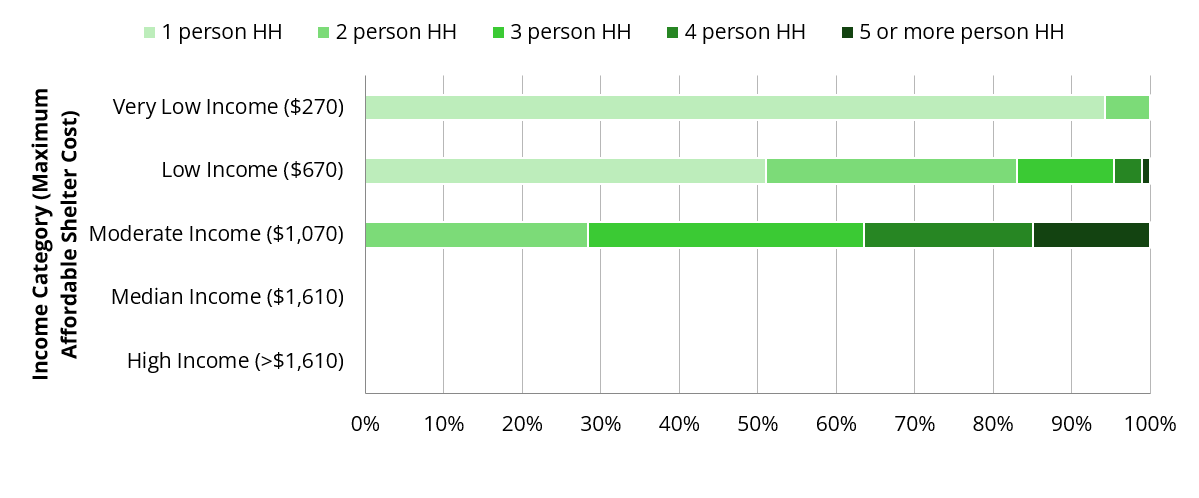
This graph shows the breakdown of household size for households in core housing need. For example, this graph shows that of Moderate Income households (maximum affordable monthly shelter cost $1,070), over 70% of households in core housing need were made up of three or more people, and over 35% require space for four or more people.
Total Affordable Housing Deficit (2016)
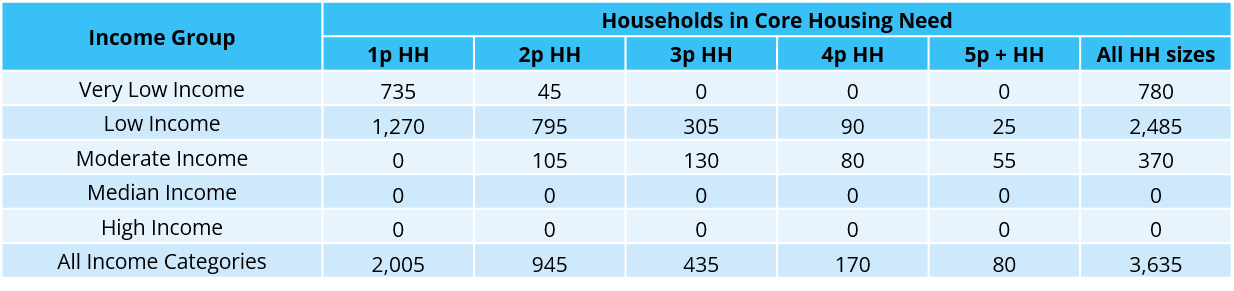
This table shows the 2016 existing housing deficit at each income category level. For example, in 2016 there was a deficit of at least 1,270 one-person homes that were affordable to Low Income households. This number does not necessarily indicate a lack of homes, but a lack of homes at or below the maximum affordable shelter cost for this income category.
Percentage of Households (HHs) in Core Housing Need, by Priority Population (2016)
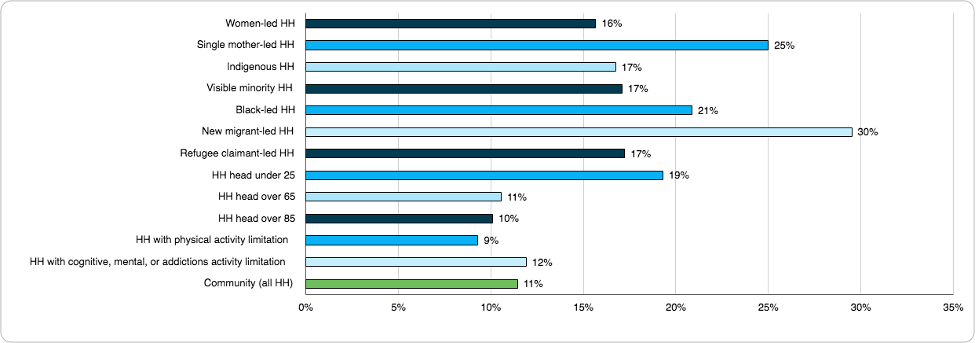
This graph shows the proportion of marginalized households in core housing need against the proportion of all households in core housing need. For example, single mother-led and new migrant-led households are nearly 3x as likely to be in core housing need than the city as a whole.
FAQ on this data
2016 was seven years ago, why does this data matter?
The census, which is the most reliable source of open-source, disaggregated data in Canada, occurs once every five years. HART will release data from the 2021 census in early 2023, however it is likely that 2016 is a more reliable determinant of housing need, as the census was administered during the distribution of the Canadian Emergency Response Benefit (CERB), which offered significant income assistance to millions of households, and dramatically impacted affordability for the lowest income groups.
Why do you use income categories?
We use five main income categories based on Area Median Income, which better reflects groups with similar needs and price elasticity than quartiles or deciles. By using Area Median Income as a basis for these categories, the data is insulated from inflation and other factors that change over time.
Where is the raw data for these graphs?
The data for these graphs, alongside with data and charts for every municipality and region in Canada, will be released by HART over the course of the next 6-8 months. Our Housing Needs Assessment Tool also includes data and charts on Loss of Affordable Housing and Household Projections, which will be published in due course.
What else is HART doing?
HART is producing three vital tools to measure and address the housing crisis in Canada: the Housing Needs Assessment Tool, Land Assessment Tool, and Property Acquisitions Strategies. These tools aim to help governments at every level to measure housing need more accurately and address need where it is most acute.